




By Felix Lee, CEO at Forgecise Expert Review & Fact-Checked by Forgecise Metallurgical Research Group Last Updated: July 25, 2026
Table of Contents
Quick Summary
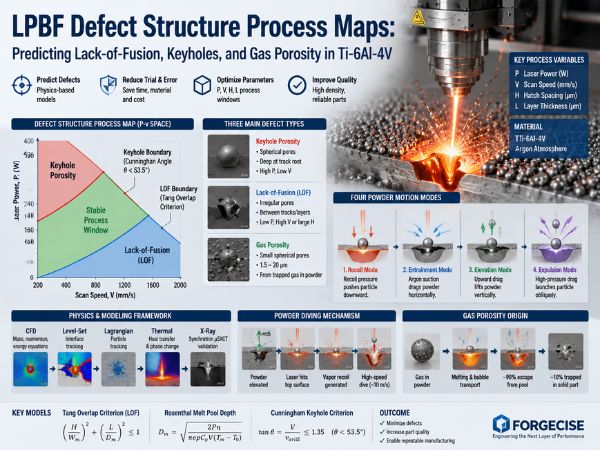
What is a Defect Structure Process Map (DSPM) in LPBF? A Defect Structure Process Map (DSPM) is a physics-based chart that plots laser power ($P$), scan speed ($V$), and hatch spacing ($H$) to show exactly where different manufacturing defects form in metal 3D printing. Instead of guessing through endless trial-and-error tests, engineers use DSPMs to pinpoint safe printing settings.
Why does Volumetric Energy Density (VED) fail to predict defects? VED reduces process settings to a single number ($E = P / (V \cdot H \cdot L)$). This fails because different parameter combinations can yield the exact same VED value while creating totally different melt pool shapes—leading to lack-of-fusion in one setup and keyhole collapse in another.
How do you predict LPBF defect boundaries? * Lack-of-Fusion (LOF): Caused by poor melt track overlap. Predicted by combining Tang’s geometric overlap model $\left(\frac{H}{W_m}\right)^2 + \left(\frac{L}{D_m}\right)^2 \le 1$ with the 3D Rosenthal thermal equation for melt pool depth ($D_m$) and width ($W_m$).
- Keyhole Porosity: Caused by vapor depression collapse under high power and low speed. Predicted when the keyhole front-wall angle drops below $53.5^\circ$ ($\tan \theta \le 1.35$) using Cunningham’s model.
- Gas Porosity: Caused by trapped gas inside feedstock powder. Around 90% of gas bubbles escape during melting, but roughly 10% stay trapped in the solid part.
1. The Core Challenge in LPBF Quality Control
Laser Powder Bed Fusion (LPBF) stands out as a leading technique in metal additive manufacturing. It builds precise parts for aerospace engines, medical implants, and structural hardware. Yet, internal defects remain its biggest obstacle.
A printed part can look clean on the outside while hiding micro-voids inside. Under repeated load cycles, these hidden voids trigger fatigue cracks that destroy components. Getting LPBF parts ready for critical applications means moving away from guesswork and using clear physical models to catch defects before printing starts.
In 2020, researchers Jerard V. Gordon, Sneha P. Narra, Ross W. Cunningham, He Liu, Hangman Chen, Robert M. Suter, Jack L. Beuth, and Anthony D. Rollett published a landmark study in Additive Manufacturing titled “Defect Structure Process Maps for laser powder bed fusion additive manufacturing” (Vol 36, 101552). Their work used synchrotron micro-beam X-ray CT ($\mu$SXCT) at Argonne National Laboratory to show that internal voids follow distinct rules across parameter space.
At Forgecise, we use these principles to build predictive tools and setting guidelines. Below is a full breakdown of how Defect Structure Process Maps (DSPMs) work and how to apply them on the factory floor.
2. Why Volumetric Energy Density (VED) Falls Short
Process engineers often rely on Volumetric Energy Density (VED) to pick parameters:$$E = \frac{P}{V \cdot H \cdot L}$$
Where:
- $E$ = Energy density ($\text{J/mm}^3$)
- $P$ = Laser power ($\text{W}$)
- $V$ = Scan speed ($\text{mm/s}$)
- $H$ = Hatch spacing ($\text{mm}$)
- $L$ = Layer thickness ($\text{mm}$)
VED offers a quick rule of thumb, but it cannot reliably predict defects.
Where VED Fails
Two parameter sets can yield the same VED value yet produce opposite defects:
- Un-melted Gaps from Wide Hatch Spacing: If you widen hatch spacing $H$ and thin out layer thickness $L$, $E$ stays identical. But if $H$ stretches wider than the actual melt pool width $W_m$, un-melted powder stays trapped between scan tracks, creating severe Lack-of-Fusion (LOF) voids.
- Extreme Aspect Ratios: High power with high speed ($P\uparrow, V\uparrow$) can match the VED of low power with low speed ($P\downarrow, V\downarrow$). Yet the first setting forms a shallow conduction melt pool, while the second digs a deep, unstable keyhole.
Defect formation depends on local melt pool geometry, track overlap, and vapor pocket stability—not a single global energy value.
3. The 3 Main Types of LPBF Porosity
Synchrotron CT scans reveal three main void types in printed Ti-6Al-4V:
                          LPBF DEFECT TYPES
                                  │
         ┌────────────────────────┼────────────────────────┐
         ▼                        ▼                        ▼
┌──────────────────┐     ┌──────────────────┐     ┌──────────────────┐
│  Lack of Fusion  │     │ Keyhole Porosity │     │   Gas Porosity   │
└────────┬─────────┘     └────────┬─────────┘     └────────┬─────────┘
         │                        │                        │
 ┌───────┴───────┐        ┌───────┴───────┐        ┌───────┴───────┐
 │• Irregular    │        │• Near-Spherical│        │• Small Sphere │
 │• Large Size   │        │• Deep Location│        │• 1.5 - 20 μm  │
 │• Unmelted Pow │        │• Vapor Pinch  │        │• Feedstock Gas│
 └───────────────┘        └───────────────┘        └───────────────┘
1. Lack-of-Fusion (LOF) Porosity
- Shape & Features: Large, jagged, non-spherical cavities that often contain un-melted powder grains.
- Cause: Low energy input that leaves melt tracks too narrow or shallow to melt adjacent passes or underlying layers completely.
- CT Location: Found along scan track edges or layer boundaries.
2. Keyhole Porosity
- Shape & Features: Round or oval voids sitting deep at the root of melt tracks.
- Cause: High laser power combined with low scan speed ($P\uparrow, V\downarrow$). Metal vapor pressure pushes down on liquid metal, carving a deep, narrow cavity. As liquid walls ripple and collapse, gas pockets break off at the bottom and get frozen in place by fast cooling.
- CT Location: Concentrated near the base of deep melt passes.
3. Gas Porosity
- Shape & Features: Tiny, smooth spheres ranging from $1.5\ \mu\text{m}$ to $20\ \mu\text{m}$ across.
- Cause: Gas pockets trapped inside the metal powder during atomization (such as argon bubbles). As the laser melts the powder, these bubbles enter the liquid pool. Most float out, but some get trapped as the metal freezes.
- CT Location: Scattered across the part, even inside optimal process windows.
4. Test Layout and Synchrotron CT Setup
Gordon et al. ran controlled printing tests on an EOS M290 machine using plasma-atomized EOS Ti-6Al-4V powder.
Baseline Settings & Matrix
- Baseline Settings (Sample 1): Laser Power $P = 280\text{ W}$, Scan Speed $V = 1200\text{ mm/s}$, Hatch Spacing $H = 140\ \mu\text{m}$, Layer Thickness $L = 30\ \mu\text{m}$.
- Test Matrix: 12 cubic blocks were printed by adjusting $P$, $V$, and $H$ around the baseline setting to map LOF risk, keyhole risk, and track overlap limits.
Synchrotron Micro-CT ($\mu$SXCT) Details
- Facility: Argonne National Laboratory Advanced Photon Source (APS).
- 3D Pixel Size: $0.65\ \mu\text{m}$ voxel size.
- Detection Limit: Smallest resolvable pore diameter $\approx 1.5\ \mu\text{m}$.
- Why It Matters: Synchrotron CT resolves tiny features below $1\ \mu\text{m}$, allowing clear physical differentiation between gas pores and keyhole/LOF voids.
5. Physical Math Models for Defect Boundaries
                 P-V PARAMETER SPACE & DEFECT BOUNDARIES
  Laser
  Power (P)
    ▲
    │  [Keyhole Porosity Zone]
    │  (High P, Low V -> Vapor Depression Collapse)
    │  ------------------------------------------------- Keyhole Boundary (Cunningham Angle)
    │
    │            =================================
    │            │     STABLE PROCESS WINDOW     │  <- Optimal Density
    │            │   (Gas Porosity Baseline)     │
    │            =================================
    │  ------------------------------------------------- LOF Boundary (Tang Geometric Model)
    │  [Lack-of-Fusion Zone]
    │  (Low P, High V -> Insufficient Overlap)
    └─────────────────────────────────────────────────────────► Scan Speed (V)
5.1 The Lack-of-Fusion Boundary
LOF happens when adjacent scan tracks fail to overlap sideways or downward. Gordon et al. used Tang’s geometric overlap model:$$\left(\frac{H}{W_m}\right)^2 + \left(\frac{L}{D_m}\right)^2 \le 1$$
Where:
- $H$ = Hatch Spacing ($\mu\text{m}$)
- $W_m$ = Melt Pool Width ($\mu\text{m}$)
- $L$ = Layer Thickness ($\mu\text{m}$)
- $D_m$ = Melt Pool Depth ($\mu\text{m}$)
How the Math Works
- $\frac{H}{W_m}$ tracks sideways overlap. If $H \ge W_m$, gaps form between side-by-side tracks.
- $\frac{L}{D_m}$ tracks vertical re-melt depth. If $L \ge D_m$, the laser fails to penetrate the previous layer.
- If the sum of their squared ratios exceeds $1$, un-melted gaps form, creating LOF defects.
Calculating Melt Pool Geometry with the Rosenthal Solution
To estimate melt pool depth $D_m$ analytically without cutting open sample parts, use the 3D Rosenthal point heat source equation:$$D_m = \sqrt{\frac{2 P \eta}{\pi e \rho C_p V (T_m – T_0)}}$$
Where:
- $P$ = Laser power ($\text{W}$)
- $\eta$ = Material absorptivity ($\eta \approx 0.35 – 0.40$ for Ti-6Al-4V under fiber lasers)
- $e$ = Euler’s constant ($\approx 2.71828$)
- $\rho$ = Material density ($\approx 4430\text{ kg/m}^3$)
- $C_p$ = Specific heat capacity ($\approx 526\text{ J/(kg}\cdot\text{K)}$)
- $V$ = Scan speed ($\text{m/s}$)
- $T_m$ = Melting point ($\approx 1660^\circ\text{C} = 1933\text{ K}$)
- $T_0$ = Powder bed base temperature ($\text{K}$)
Assuming a simple semicircular melt pool cross-section:$$W_m \approx 2 D_m$$
Test Results
- Sample 9 (Outside LOF Boundary): Set with low power and high speed relative to hatch spacing. Synchrotron CT showed irregular LOF voids reaching 0.34%.
- Sample 1 (Baseline, Inside Boundary): Met Tang’s criterion. Synchrotron CT showed irregular LOF porosity below 0.0056% (a 60x reduction).
5.2 The Keyhole Porosity Boundary
High laser power combined with slow speed pushes the process into keyhole mode. Metal turns to vapor, and recoil pressure drills a deep hole into the liquid pool.
Gordon et al. applied Cunningham’s keyhole instability model based on high-speed X-ray imaging. Keyhole collapse relates to the front-wall inclination angle ($\theta$):$$\tan \theta = \frac{V}{v_{\text{drill}}}$$
Where:
- $V$ = Scan speed ($\text{mm/s}$)
- $v_{\text{drill}}$ = Laser drilling speed into the melt pool ($\text{mm/s}$)
The Critical Boundary Threshold
When high laser energy creates a steep front wall such that:$$\theta < 53.5^\circ \quad \left(\text{or } \tan \theta \le 1.35\right)$$
The liquid front wall collapses. Waves ripple across the cavity, pinching off vapor bubbles at the root that turn into keyhole voids.
Test Results
- Sample 2 (High Power, Low Speed): Driven deep into keyhole territory. Synchrotron CT recorded spherical keyhole voids spiking to 0.67%, dominated by round holes at track roots.
- Sample 1 (Standard Settings): Kept a stable keyhole angle; round voids remained negligible.
6. How Hatch Spacing ($H$) Affects Heat Build-Up
Changing hatch spacing $H$ affects track overlap and shifts heat accumulation across adjacent passes.
                           HATCH SPACING EFFECTS
                                     │
         ┌───────────────────────────┴───────────────────────────┐
         ▼                                                       ▼
┌─────────────────────────────────┐             ┌─────────────────────────────────┐
│     Hatch Spacing Too Large     │             │     Hatch Spacing Too Small     │
│          (H > W_m)              │             │          (H << W_m)             │
└────────────────┬────────────────┘             └────────────────┬────────────────┘
                 │                                               │
                 ▼                                               ▼
┌─────────────────────────────────┐             ┌─────────────────────────────────┐
│ Insufficient Transverse Overlap │             │ Severe Thermal Accumulation     │
│ -> Lack of Fusion Voids         │             │ -> Pushes Pool into Keyhole Zone│
└─────────────────────────────────┘             └─────────────────────────────────┘
Analysis of Test Samples 10, 11, and 12
- Samples 10 & 11 (Tight Hatch Spacing): Keeping $P$ and $V$ constant while tightening $H$ increases track overlap. However, testing showed that unusually tight hatch spacing increases round pore counts. Close passes trap local heat, raising local bed temperature $T_0$, deepening melt depth $D_m$, and pushing stable melt pools into keyhole collapse.
- Sample 12 (Wide Hatch Spacing): Widening $H$ boosts build speed. But even when math models predict safe boundaries, real-world liquid motion, spatter, and powder packing variations leave occasional LOF gaps.
Rules for Hatch Spacing:
- Avoid setting $H$ purely to maximize build speed.
- Avoid ultra-tight spacing that traps heat and triggers keyhole collapse.
- Geometric models give a strong baseline; add a 10–15% safety overlap margin for real-world printing.
7. How Powder Gas Voids Move Into Printed Parts
Even inside a clean process window where LOF and keyhole voids disappear, printed parts keep a small background level of gas porosity ($\sim 0.01\% – 0.05\%$). Gordon et al. tracked how gas moves from powder feedstock into finished metal.
                   POWDER-TO-PART GAS TRANSFER DYNAMICS
                                     │
 ┌───────────────────────────────────┴───────────────────────────────────┐
 │ 1. Atomized Feedstock Powder with Trapped Gas Pockets                 │
 └───────────────────────────────────┬───────────────────────────────────┘
                                     │
                                     ▼
 ┌───────────────────────────────────────────────────────────────────────┐
 │ 2. Powder Pulled into Laser Melt Pool (Denudation & Melting)          │
 └───────────────────────────────────┬───────────────────────────────────┘
                                     │
                                     ▼
 ┌───────────────────────────────────────────────────────────────────────┐
 │ 3. Bubble Dynamics: Buoyancy vs. Marangoni Flow vs. Solidification    │
 └───────────────────────────────────┬───────────────────────────────────┘
                                     │
                     ┌───────────────┴───────────────┐
                     ▼                               ▼
     ┌───────────────────────────────┐ ┌───────────────────────────────┐
     │ ~90% Gas Bubbles Escape       │ │ ~10% Trapped as Gas Pores     │
     │ through Melt Pool Surface     │ │ in Final Solidified Part      │
     └───────────────────────────────┘ └───────────────────────────────┘
7.1 Plasma Atomized (PA) vs. PREP Powder
The study tested two Ti-6Al-4V powder types:
- EOS Plasma Atomized (PA) Powder
- Plasma Rotating Electrode Process (PREP) Powder
Gas Void Scaling Math
Pore volume $V_p$ and radius $r_p$ follow standard sphere geometry:$$V_p = \frac{4}{3}\pi r_p^3 \implies r_p = \left(\frac{3 V_p}{4\pi}\right)^{1/3}$$
For PREP powder, a power-law relationship connects internal gas pore radius $r_{\text{pore}}$ to host powder particle radius $r_{\text{particle}}$:$$r_{\text{pore}} \propto r_{\text{particle}}^\beta \quad (\text{where } \beta \approx 0.34)$$
- PREP Powder Traits: Fewer total gas voids, but individual trapped pores are slightly larger.
- PA Powder Traits: Higher overall void count, but pore size shows no clear link to particle size due to gas trapping during spray atomization.
7.2 The 90% Escape Rule
High-speed X-ray scans showed that about 90% of internal gas voids escape while the metal is liquid.
- As gas-filled powder melts, strong liquid currents and buoyancy drag gas bubbles to the surface where they pop.
- However, around 10% stay trapped when fast freezing rates ($10^5 – 10^6\text{ K/s}$) catch bubbles before they reach the surface.
Maximum Trapped Pore Sizes
- PA Powder Parts: Largest trapped gas pore diameter $\approx 15 – 20\ \mu\text{m}$.
- PREP Powder Parts: Largest trapped gas pore diameter $\approx 10 – 15\ \mu\text{m}$.
For fatigue-critical components, parameter tuning is only half the job—using low-porosity PREP powders or degassed stock is essential for top performance.
8. Experimental Data Summary Table
Here is a side-by-side comparison of key sample blocks from Gordon et al. (2020):
| Sample ID | Laser Power $P$ (W) | Scan Speed $V$ (mm/s) | Hatch Spacing $H$ ($\mu\text{m}$) | Location on Process Map | Main Defect Observed | Measured CT Porosity |
|---|---|---|---|---|---|---|
| Sample 1 | 280 (Baseline) | 1200 | 140 | Stable Window | Minor Gas Pores | $< 0.0056\%$ (LOF) |
| Sample 2 | High $P$ | Low $V$ | 140 | Keyhole Zone | Round Keyhole Voids | $\sim 0.67\%$ (Spherical) |
| Sample 9 | Low $P$ | High $V$ | 140 | Lack-of-Fusion Zone | Irregular LOF Cavities | $\sim 0.34\%$ (Irregular) |
| Sample 10 | 280 | 1200 | Tight | Heat Accumulation | Keyhole / Round Voids | High Spherical Count |
| Sample 11 | 280 | 1200 | Moderate | Heat Accumulation | Moderate Keyhole Voids | Medium Spherical Count |
| Sample 12 | 280 | 1200 | Wide | Near LOF Border | Minor LOF Cavities | Low-to-Medium LOF |
9. 5 Steps to Select LPBF Parameters Without Trial and Error
                  5-STEP PROCESS OPTIMIZATION WORKFLOW
                                     │
 ┌───────────────────────────────────┴───────────────────────────────────┐
 │ STEP 1: Analytical LOF Boundary Screening                             │
 │ Calculate D_m & W_m via Rosenthal Model; apply Tang Criterion.      │
 └───────────────────────────────────┬───────────────────────────────────┘
                                     │
                                     ▼
 ┌───────────────────────────────────────────────────────────────────────┐
 │ STEP 2: Keyhole Instability Limit Evaluation                          │
 │ Evaluate V/v_drill ratio; enforce Keyhole angle threshold > 53.5°.   │
 └───────────────────────────────────┬───────────────────────────────────┘
                                     │
                                     ▼
 ┌───────────────────────────────────────────────────────────────────────┐
 │ STEP 3: Hatch Spacing & Thermal Accumulation Balancing                │
 │ Set H to preserve 15-20% overlap margin without excessive heat build.│
 └───────────────────────────────────┬───────────────────────────────────┘
                                     │
                                     ▼
 ┌───────────────────────────────────────────────────────────────────────┐
 │ STEP 4: Raw Feedstock Powder Quality Audit                            │
 │ Conduct CT or pycnometry on powder; prefer PREP for critical parts.   │
 └───────────────────────────────────┬───────────────────────────────────┘
                                     │
                                     ▼
 ┌───────────────────────────────────────────────────────────────────────┐
 │ STEP 5: Targeted Micro-CT & Metallographic Verification              │
 │ Print narrow test matrix in predicted DSPM window to verify density.  │
 └───────────────────────────────────────────────────────────────────────┘
Step 1: Filter the LOF Boundary
- Gather material thermal values ($\rho, C_p, T_m, \eta$).
- Estimate depth $D_m$ and width $W_m$ across candidate $P$ and $V$ pairs with the 3D Rosenthal equation.
- Remove parameters that break Tang’s limit: $\left(\frac{H}{W_m}\right)^2 + \left(\frac{L}{D_m}\right)^2 > 0.85$ (including a 15% safety factor).
Step 2: Check Keyhole Limits
- Calculate drilling speed $v_{\text{drill}}$ and front-wall angle $\theta$.
- Remove settings where keyhole angle drops below $53.5^\circ$ ($\tan\theta \le 1.35$).
Step 3: Balance Hatch Spacing
- Set hatch spacing $H$ to maintain a side overlap ratio $H/W_m \approx 0.6 – 0.75$.
- Use scan vector rotation ($67^\circ$) to avoid trapping heat in local spots.
Step 4: Audit Powder Quality
- Test powder batches for gas content using CT or pycnometry.
- Choose PREP or vacuum-atomized powder for high-fatigue applications.
Step 5: Verify Final Settings
- Print a small test set (5–8 blocks rather than dozens) inside your calculated DSPM window.
- Confirm density using Archimedes testing, optical cross-sections, or micro-CT.
10. Frequently Asked Questions (FAQ)
What is the difference between lack-of-fusion and keyhole porosity in 3D printing?
Lack-of-fusion voids are large, irregular cavities caused by insufficient laser heat and bad track overlap. Keyhole pores are round voids formed when high laser power burns a deep hole that collapses and traps gas at the bottom of the melt pool.
How do you prevent gas porosity in LPBF parts?
Gas porosity comes directly from hollow powder grains. You can reduce it by using high-grade PREP powder, vacuum-degassing feedstock, or using optimized laser parameters that keep the melt pool open long enough for gas bubbles to escape.
Why is Volumetric Energy Density (VED) unreliable for setting LPBF parameters?
VED treats four different settings ($P, V, H, L$) as a single number. Two different setups can share the same VED value while producing totally different melt pool shapes—leading to lack-of-fusion in one build and keyhole collapse in another.
What CT resolution is needed to detect LPBF defects?
Standard laboratory CT can detect large LOF and keyhole voids down to $10 – 20\ \mu\text{m}$. Detecting small gas pores ($1.5 – 10\ \mu\text{m}$) requires synchrotron X-ray CT with voxel sizes around $0.65\ \mu\text{m}$.
Technical References & Citation
To cite the research paper referenced in this guide:
@article{gordon2020defect,
  title={Defect structure process maps for laser powder bed fusion additive manufacturing},
  author={Gordon, Jerard V and Narra, Sneha P and Cunningham, Ross W and Liu, He and Chen, Hangman and Suter, Robert M and Beuth, Jack L and Rollett, Anthony D},
  journal={Additive Manufacturing},
  volume={36},
  pages={101552},
  year={2020},
  publisher={Elsevier},
  doi={10.1016/j.addma.2020.101552}
}
For technical consulting, LPBF process parameter optimization, or digital twin implementations, contact Felix Lee and the engineering team at Forgecise.com.